
 Interactive: Visualizing Global Climate Change
Global Climate Parameters
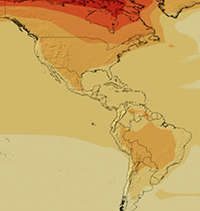 |
This is an interactive visualization of global climate parameters based on a model generated using Columbia University's EdGCM modeling program. The applet allows the user to compare annual surface temperatures and other climate variables at different locations on the earth for the period 1950 - 2100. It is based on the Intergovernmental Panel on Climate Change (IPCC) scenarios. Run Visualization |
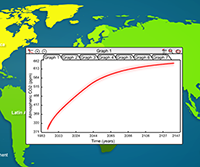
Global Carbon Dioxide Footprint and Model
The CO2 footprint model is a geopolitical treatment of the problem of global increase in the concentration of greenhouse gases. The user can adjust the per capita emissions from various regions of the globe and then run a 4-box model of CO2 concentration in the atmosphere over the next 150 years. In this model a 4-way interaction between biosphere, atmosphere, mid-ocean and deep-ocean is calculated. This will help underscore the need to understand CO2 and other greenhouse gases as long-term issues. |
 |
Planetary Climates: A Delicate Balance
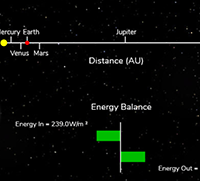 |
Climate is regulated by the delicate balance of incoming and outgoing electromagnetic radiation. This visualization first explores the climatic condition of various planets, focusing on Mars, Venus, and Earth. The second portion of this visualization, the "Build a Planet" simulator, allows a user to alter the four factors that regulate climate: albedo, greenhouse effect, distance from the sun, and surface temperature. Run Visualization |
